Amazon Fundamentals
How to Run an Amazon SKU Rationalization Audit: The Grow-Fix-Kill Framework for Multi-SKU Sellers
Amazon SKU rationalization made simple: use the Grow-Fix-Kill framework and five data points to cut dead stock, protect margin, and focus on winners.

A catalog of 200 SKUs, a team that can optimize 20 this quarter, and rising FBA storage fees eating margin on the other 180. That’s the resource allocation problem most multi-SKU Amazon sellers never solve. They just optimize whatever feels urgent that week.
Amazon SKU rationalization fixes this by forcing every product in the catalog through a structured decision matrix. In many catalogs, a small share of SKUs drives most of the revenue, yet sellers still spread optimization time, PPC budget, and creative work evenly across the entire portfolio. With paid traffic costs climbing and aged-inventory surcharges compounding, that dilution has moved from lost opportunity to active margin destruction.
This guide walks through the Grow-Fix-Kill framework: a way to classify every SKU using five data points, then take a targeted action on each bucket. Unlike generic advice, it connects portfolio decisions directly to listing-level work, especially the critical “Fix” bucket where most revenue growth actually happens.
What is Amazon SKU rationalization?
Amazon SKU rationalization is the process of evaluating every product in a catalog against profitability, velocity, and keyword performance, then deciding which SKUs to invest in, optimize, or discontinue.
Most sellers intuitively know that a small portion of their catalog drives most of the sales, but few have actually run the numbers. Rationalization goes beyond standard inventory management (which focuses on stock levels) to address the strategic value of each product. It asks whether a product should be in the catalog at all, not just how many units to reorder.
The cost of inaction is tangible. Every underperforming SKU consumes storage fees, absorbs PPC budget that could go to winners, and takes optimization hours away from products with real growth potential. When a 500-SKU catalog has 300 items barely breaking even, the profitable 200 are effectively subsidizing the rest.
Decisions here rely on accurate fee and performance data. Reviewing your Amazon listing optimization baseline before cutting anything helps confirm whether a weak SKU is truly a lost cause or just poorly presented.
Why do multi-SKU sellers need SKU rationalization now?
Rising FBA storage fees, higher paid traffic costs, and aged-inventory surcharges make carrying underperforming SKUs more expensive in 2026 than it was a few years ago.
Amazon’s fee structure has shifted to penalize inefficiency. Aged-inventory surcharges apply to items sitting in FBA for extended periods, with rates that step up the longer stock sits. Exact per-unit amounts and cubic-foot rates change over time, so pull the current numbers from Amazon’s FBA fee schedule before modeling costs. Consider a catalog where 60 SKUs are over a year old with 10 units each in stock. The monthly aged surcharge alone can run into the hundreds of dollars before standard storage fees are added.
Paid traffic costs are also up. Sponsored Products CPCs averaged roughly $1.00 to $1.05 as of 2025 per Jungle Scout’s State of the Amazon Seller report, and Sponsored Brands clicks typically ran higher. Every dollar spent advertising a low-margin, low-converting SKU is a dollar not spent on a product that could actually capture share. Our Amazon PPC optimization guide covers how to reallocate that budget once you’ve identified the winners.
For agencies managing dozens of brands, the opportunity cost of optimization time is the deciding factor between profitability and burnout. Prioritization isn’t optional, it’s survival.
How does the Grow-Fix-Kill framework work?
The Grow-Fix-Kill framework sorts every SKU into three action buckets based on margin, sales velocity, keyword traction, conversion rate, and storage cost ratio.
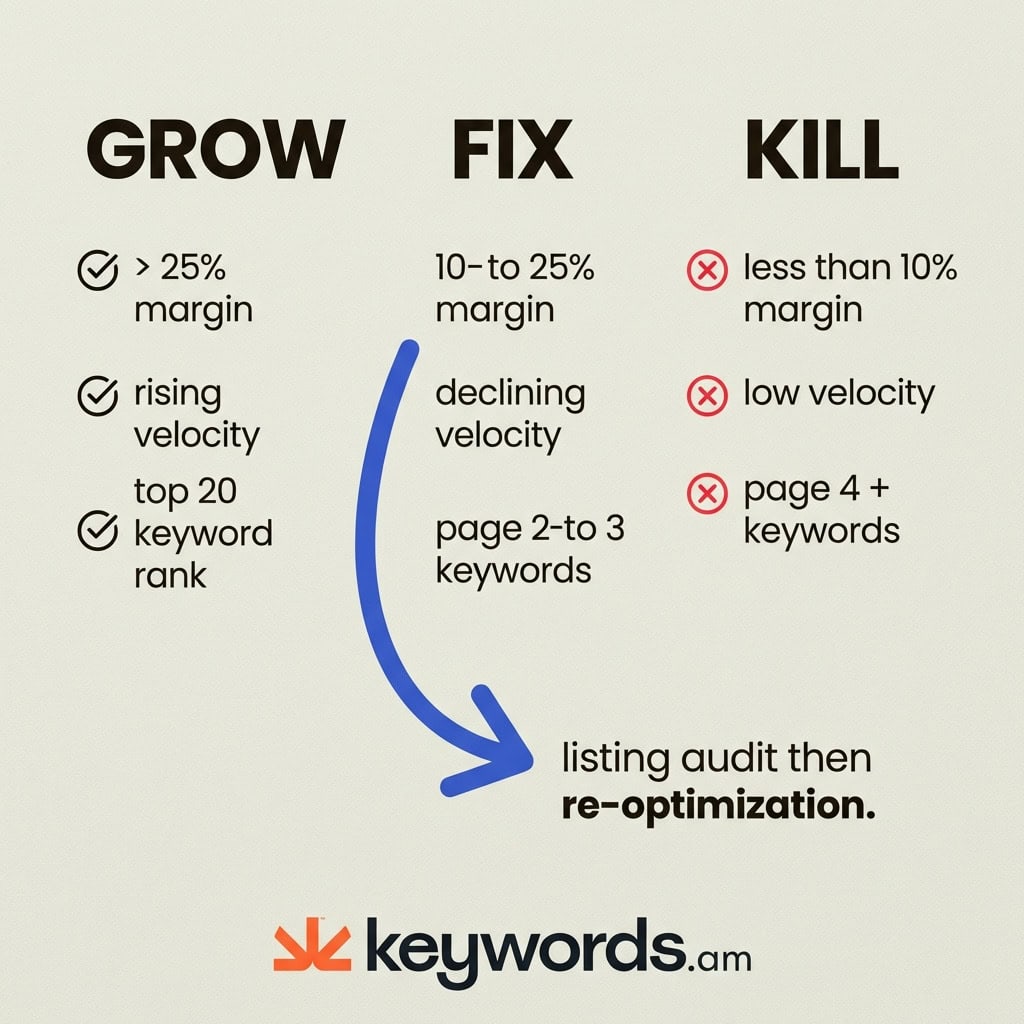
The framework turns messy portfolio data into three clear directives.
GROW bucket. These are the winners: contribution margin above 25%, stable or rising sales velocity over the last 90 days, and top-20 rank for primary keywords. The strategy is aggressive investment. Increase PPC spend, expand variations, and invest in premium creative like A+ Content and video.
FIX bucket. These SKUs have decent margin potential (10-25%) but are held back by poor listing quality, weak keyword targeting, or declining rank. They’re often stuck on page 2 or 3 of search. Action: audit and re-optimize using a structured process.
KILL bucket. These SKUs are dragging the business down: margin under 10%, consistently declining velocity, and storage cost above 5% of revenue. If a product has shown no ranking improvement in 90 days despite effort, it belongs here. Action: liquidate, remove, or discontinue.
Grow-Fix-Kill decision matrix
| Criteria | GROW | FIX | KILL |
|---|---|---|---|
| Contribution margin | Above 25% | 10-25% | Below 10% |
| Sales velocity (90-day trend) | Stable or rising | Declining but recoverable | Consistently declining |
| Keyword ranking | Top 20 for primary keywords | Page 2-3 with gaps | Page 4+ or unranked |
| Conversion rate vs category | At or above average | Below average but fixable | Significantly below |
| Storage cost as % of revenue | Below 2% | 2-5% | Above 5% |
For SKUs in the Fix bucket, the TFSD framework provides a systematic way to address the specific listing deficiencies holding them back.
What are the five data points that drive SKU decisions?
The five data points are 90-day sales velocity trend, contribution margin after all fees, keyword ranking trajectory, conversion rate versus category average, and storage cost as a percentage of revenue.

Sales velocity trend (90 days). Absolute sales volume can mislead. A SKU generating $2,000 per month but declining 15% month-over-month needs a different strategy than one at $800 per month growing 20%. The trend reveals the product’s lifecycle stage, and 90 days filters out short-term noise.
Contribution margin after all fees. True contribution margin is revenue minus COGS, FBA fees, referral fees, PPC spend, and returns. That’s the cash that actually hits the bank. Thin margins can flip negative with a small CPC bump or a storage fee change, so calculating this accurately is non-negotiable. Our Amazon ACoS and TACoS guides walk through the ad-cost side of this math.
Keyword ranking trajectory. Revenue is a lagging indicator; keyword rank is a leading one. A SKU slowly losing organic positions on its main terms will eventually see sales collapse. Tracking rank direction spots the problem before revenue drops.
Conversion rate vs category average. Context matters. A 5% conversion rate might be excellent for high-ticket electronics and terrible for consumables. Benchmarking against category norms clarifies whether the issue is the product or the traffic. Our Amazon conversion rate guide covers realistic benchmarks by category.
Storage cost as % of revenue. The silent margin killer. If storage fees eat more than 5% of a single SKU’s revenue, the rest of the catalog is subsidizing it.
How do you run a SKU rationalization audit step by step?
Export the full catalog from Seller Central, pull the five metrics for each SKU, score them against Grow-Fix-Kill thresholds, and prioritize actions by bucket and margin impact.
Step 1: Export the full SKU list. In Seller Central, go to Business Reports and download the “By ASIN, Detail Page Sales and Traffic” report. This gives you sessions and unit session percentage (conversion rate). Use at least a 90-day window to capture trends.
Step 2: Calculate contribution margin. Build a spreadsheet with this formula for each SKU: Revenue minus (COGS + FBA fees + referral fees + PPC spend + returns). The Amazon Revenue Calculator estimates fees, but pulling actuals from reports is more precise.
Step 3: Pull keyword ranking data. Use a rank tracker to see 90-day history for the top three to five keywords per SKU. Note direction, not just current position. A reverse ASIN lookup can also reveal which competitor keywords your SKUs aren’t capturing.
Step 4: Score each SKU. Apply the matrix thresholds. A simple G/F/K score across the five criteria works well. Majority rules, with contribution margin as tiebreaker. A high-velocity, negative-margin product can’t be a Grow until the margin problem is solved.
Step 5: Sort and prioritize. Within the Fix bucket, sort by potential margin impact. A 20%-margin underperformer beats a 12%-margin underperformer for immediate work. That’s where the team should focus first.
What should sellers do with Fix SKUs?
Fix SKUs need a listing audit to identify keyword gaps, content weaknesses, and missed search terms, followed by systematic re-optimization using the TFSD framework.
The Fix bucket typically has the highest ROI for an optimization team. These products have valid demand but suffer from execution errors. Start with a reverse ASIN report to see which keywords competitors rank for that your SKU is missing. This gap analysis usually surfaces immediate traffic opportunities.
Next, prioritize the target keywords by relevance and rankability, not just raw search volume. Our Amazon search volume guide explains why volume alone is a misleading metric.
Once targets are set, apply the TFSD framework to re-optimize:
- Title: Lead with primary high-volume keywords while keeping it readable. See our Amazon product title optimization guide.
- Features (bullets): Focus on benefits, weave in secondary keywords. Details in the Amazon bullet points guide.
- Search terms: Fill the backend field with terms not used in the front end. Full breakdown in Amazon backend keywords.
- Description or A+ Content: Use this space for long-tail and contextual terms. Covered in A+ Content optimization.
After re-optimizing, monitor for 30-60 days. If conversion and rankings lift, the SKU moves to Grow. If not, it may need to be reclassified as Kill.
When should sellers discontinue Amazon products?
Sellers should discontinue products when contribution margin stays below 10%, keyword rankings don’t improve after optimization, and storage costs exceed 5% of that SKU’s revenue.
Kill decisions are often emotional, but data has to lead. When a SKU hits all three Kill criteria (low margin, no keyword traction stuck on page 4+, and high storage ratio), it’s actively harming the business. Keeping it “just in case” ties up capital that could fund a winner.
Liquidation options include:
- Amazon Outlet: Clear overstock through Amazon’s own discount channel.
- Lightning Deals: Aggressive short-window deals at or near breakeven to convert inventory to cash.
- FBA Removal Orders: Have units returned or disposed of to stop the storage bleed.
- Third-party liquidation: Sell in bulk to liquidators or off-Amazon channels.
Exceptions exist. Keep a Kill SKU if it’s essential to a variation family driving traffic to the main listing, if it’s a brand registry dependency, or if it’s a seasonal product about to hit its peak window. These exceptions should be rare and documented, not the default.
Frequently Asked Questions About Amazon SKU Rationalization
How often should sellers run a SKU rationalization audit?
Quarterly is the minimum cadence for most catalogs. High-volume catalogs with 200 or more SKUs benefit from monthly reviews of the Kill bucket and a full portfolio audit each quarter to align with Amazon’s storage fee cycles. This keeps aged-inventory exposure low.
What’s the difference between SKU rationalization and inventory management?
SKU rationalization decides which products to keep, grow, or cut. Inventory management handles how much stock to carry for the products you’re keeping. Rationalization is strategic, inventory management is operational, and they work together but shouldn’t be confused.
Can small sellers with fewer than 20 SKUs benefit from this framework?
Yes. Even a 15-SKU catalog typically has three or four products that eat disproportionate storage fees and PPC budget. The framework scales down by simplifying the scoring to margin and velocity, which small sellers can review in a spreadsheet in under an hour.
How do agencies apply SKU rationalization across multiple client accounts?
Agencies run the Grow-Fix-Kill audit per client, then rank Fix SKUs across all clients by potential margin impact. This lets a small optimization team focus its hours on the highest-return work rather than spreading effort evenly across every account. It also gives account managers a clear story to tell clients about why certain SKUs get priority.
What tools are needed to pull the five data points?
Seller Central Business Reports cover velocity and conversion rate, a profitability calculator handles contribution margin, an Amazon keyword rank tracker captures ranking trajectory, and FBA fee reports show storage costs. Most sellers already have access to these through Seller Central plus one third-party tool.
Conclusion
- Rationalization protects margin: Cutting or fixing the bottom of the catalog stops profitable SKUs from subsidizing losers.
- Grow-Fix-Kill turns intuition into a system: Five data points, three buckets, and clear actions per bucket.
- Fix is where the growth is: Most Fix SKUs have demand but missing keywords or weak listing execution.
- Kill decisions free up capital: Storage fees and PPC waste on Kill SKUs compound every month you delay.
- Quarterly cadence keeps it honest: Winners drift, competitors move, and fee schedules change, so revisit the audit regularly.
Amazon SKU rationalization turns catalog management from guesswork into a system that focuses effort where it actually pays back. For Fix SKUs, start with an ASIN report to see exactly which keywords are missing and where the listing falls short. Try the free Amazon keyword tool to run that analysis in minutes, or start a Keywords.am plan to audit your full catalog on a repeatable schedule.