Amazon Fundamentals
The 7 best Amazon FBA calculators in 2026 (and the profitability variable none of them track)
Amazon FBA calculator tools compared for 2026: see which 7 handle inbound placement fees, Q4 storage hikes, and the profit lever most sellers miss.

Amazon sellers paid billions in FBA fees in 2025, yet most rely on an Amazon FBA calculator that quietly ignores at least two fee categories that hit their disbursement. The difference between a healthy 15% margin and a 3% margin often comes down to lines the calculator never showed you.
With seven major FBA calculator tools now on the market, from free browser extensions to $30/month subscriptions, sellers face a real decision. Which tool produces trustworthy numbers, and does the output actually include every fee that hits your account?
This article compares the seven major Amazon FBA calculator tools side by side, walks through a real profit calculation with every 2026 fee line item, and explains the one profitability variable that no calculator can estimate for you.
How does an Amazon FBA calculator work?
An Amazon FBA calculator estimates net profit by subtracting referral fees, fulfillment fees, storage, and other Amazon charges from a product’s selling price. You give it three inputs (selling price, product cost, and inbound shipping), and it strips out Amazon’s fee layers one by one.
Referral fees hit first, usually 8% to 15% depending on category. Fulfillment fees come next, tied strictly to size and weight tiers. Storage stacks up every month, and better tools also add inbound placement fees and aged inventory surcharges.
If you’re new to the platform, what is Amazon FBA covers the basics. The real gap between free and paid calculators is data depth: free tools handle the standard fee structure, while paid tools add ASIN lookup, historical data, and multi-marketplace support.
Knowing what a calculator does matters less than knowing which one gets the numbers right.
Which are the 7 best Amazon FBA calculators for 2026?
The best FBA calculators for 2026 include Amazon’s free Revenue Calculator for baseline checks, Helium 10 for ASIN lookup, and SellerApp for FBA vs FBM comparisons across 16 marketplaces. Every calculator gets some fees right and misses others.
What catches most sellers off guard is the fee sprawl. There are now seven-plus fee categories to model versus the three or four that budget tools bother with. The table below shows what each tool actually delivers.
| Tool | Pricing | Marketplaces | ASIN Lookup | FBA vs FBM | Best For |
|---|---|---|---|---|---|
| Amazon Revenue Calculator | Free | 1 (US) | Yes | No | Baseline fee checks |
| Helium 10 | Free tier / $29+/mo | 13+ | Yes | No | ASIN-driven data pulls |
| Jungle Scout | Free (web) / $49+/mo | 17 | No (manual) | No | Product research integration |
| SellerApp | Free (Chrome) | 16 | Yes | Yes | Multi-marketplace FBA vs FBM |
| ProfitGuru | $29/mo | 1 (US only) | Yes | No | Per-seller sales breakdown |
| AMZScout | Free (Chrome) | 12 | Yes | No | Beginners wanting quick estimates |
| Seller Assistant | $15.99/mo | All major | Yes | Yes | Wholesale/arbitrage BSR analysis |
1. Amazon Revenue Calculator
The Amazon Revenue Calculator is free and Amazon-maintained, so it’s where most sellers start. It covers referral fees, basic fulfillment, and standard monthly storage.
What it won’t show you: inbound placement fees, aged inventory surcharges, and returns processing. On a product with a tight margin, those three missing lines can be the difference between 15% profit and breakeven. Treat the number as a floor, not a final answer.
2. Helium 10 Profitability Calculator
Helium 10 has a free version for the basics, with paid tiers starting around $29/month as of 2025. Feed it an ASIN and it auto-populates dimensions, weight, and category fees without a spreadsheet.
The 13+ marketplace coverage helps if you sell in the UK or Germany alongside the US. Full ASIN data and advanced filters sit behind the paywall.
3. Jungle Scout FBA Calculator
You don’t need an account to use Jungle Scout’s free web calculator. Subscribers get deeper integration with the product database across 17 marketplaces, which lines up neatly with Amazon competitor analysis workflows.
The free version needs manual input, and there’s no FBA vs FBM view.
4. SellerApp FBA Calculator
SellerApp’s free Chrome extension covers 16 marketplaces and does something most competitors skip: side-by-side FBA vs FBM comparison. If you’re on the fence about fulfillment methods, it saves hours of spreadsheet work.
The only catch is that it’s Chrome-only, with no standalone web version.
5. ProfitGuru
ProfitGuru runs about $29/month and only works in the US as of 2025. The differentiator is per-seller revenue breakdowns: you can see what individual sellers earn on any ASIN, which is useful for competitive research.
If you sell outside the US, look elsewhere.
6. AMZScout
AMZScout has a free Chrome extension that works across 12 marketplaces and shows fee estimates, profit, ROI, and projected monthly revenue right on the listing page. New sellers gravitate to it because there’s zero setup.
The downside is you can’t export data cleanly, and the free version pushes upgrade prompts constantly.
7. Seller Assistant
At $15.99/month as of 2025, Seller Assistant is built for the wholesale and arbitrage crowd. BSR drop tracking, ROI thresholds, and pricing trend analysis are the core features.
The Keepa integration pulls 90-day or 180-day price history on any ASIN without opening a separate tab, which speeds up seasonal sourcing decisions.
Comparing features on paper is one thing. The only way to know if a calculator works for your business is to run your own product numbers through it and see whether the output survives contact with your actual bank deposits.
What does a real FBA profit calculation look like in 2026?
Take a kitchen gadget from a supplier catalog: 12 ounces, $24.99 retail, $6.00 landed cost. Run it through every 2026 fee line and net profit lands somewhere between $7.50 and $9.00 per unit depending on when the units sell and your category’s return rate.
Here’s the math with nothing left out:
| Line Item | Amount | Notes |
|---|---|---|
| Selling Price | $24.99 | |
| Referral Fee (15%) | -$3.75 | Home & Kitchen |
| FBA Fulfillment Fee | -$3.68 | Standard size, 12 oz (as of 2025) |
| Monthly Storage (Jan-Sep) | -$0.14 | ~$0.78/cu ft, ~0.18 cu ft |
| Monthly Storage (Oct-Dec) | -$0.43 | ~$2.40/cu ft during Q4 |
| Inbound Placement Fee | -$0.30 | Minimal split shipment |
| Returns Processing (est.) | -$0.25 | ~5% return rate, amortized |
| Landed Product Cost | -$6.00 | Factory plus inbound shipping |
| Net Profit (Jan-Sep) | ~$10.87 | ~43% margin |
| Net Profit (Q4 storage) | ~$10.58 | ~42% margin |
Notice where most free calculators stop counting? Line four. Everything after (inbound placement, returns, aged inventory) doesn’t show up in the standard tools.
If that inventory sits past 271 days, aged inventory surcharges of roughly $0.30 to $0.35 per unit start stacking on top. The calculator showed 43% margin, but your Seller Central disbursement report will tell a different story.
Once the product is live, watching these costs over time matters more than launch-day math. Amazon adjusts fees, storage rates, and surcharges throughout the year, so the gap between what a calculator estimates and what actually hits your bank widens as months go by. A monthly review inside Seller Central closes that gap.
The worked example assumes you enter accurate numbers. Most sellers don’t.
What are the 5 FBA fee mistakes calculators expose?
The five biggest mistakes are ignoring Q4 storage spikes, underestimating returns, forgetting inbound placement fees, using the wrong size tier, and skipping aged inventory surcharges. A calculator is only as good as the numbers going in.
1. Using January storage rates year-round
Storage fees are never flat. They roughly triple during Q4, moving from around $0.78/cu ft to $2.40/cu ft as of 2025. A product using 0.18 cu ft costs about $0.14/month in January and $0.43/month in October. Multiply by 1,000 units and the gap starts to sting.
2. Ignoring returns and refund processing
Return rates run 5% to 15% depending on category. Each return triggers processing fees plus refund administration on top, and most free calculators don’t even have an input field for returns. Sellers overestimate realized margin without realizing it.
3. Forgetting inbound placement fees
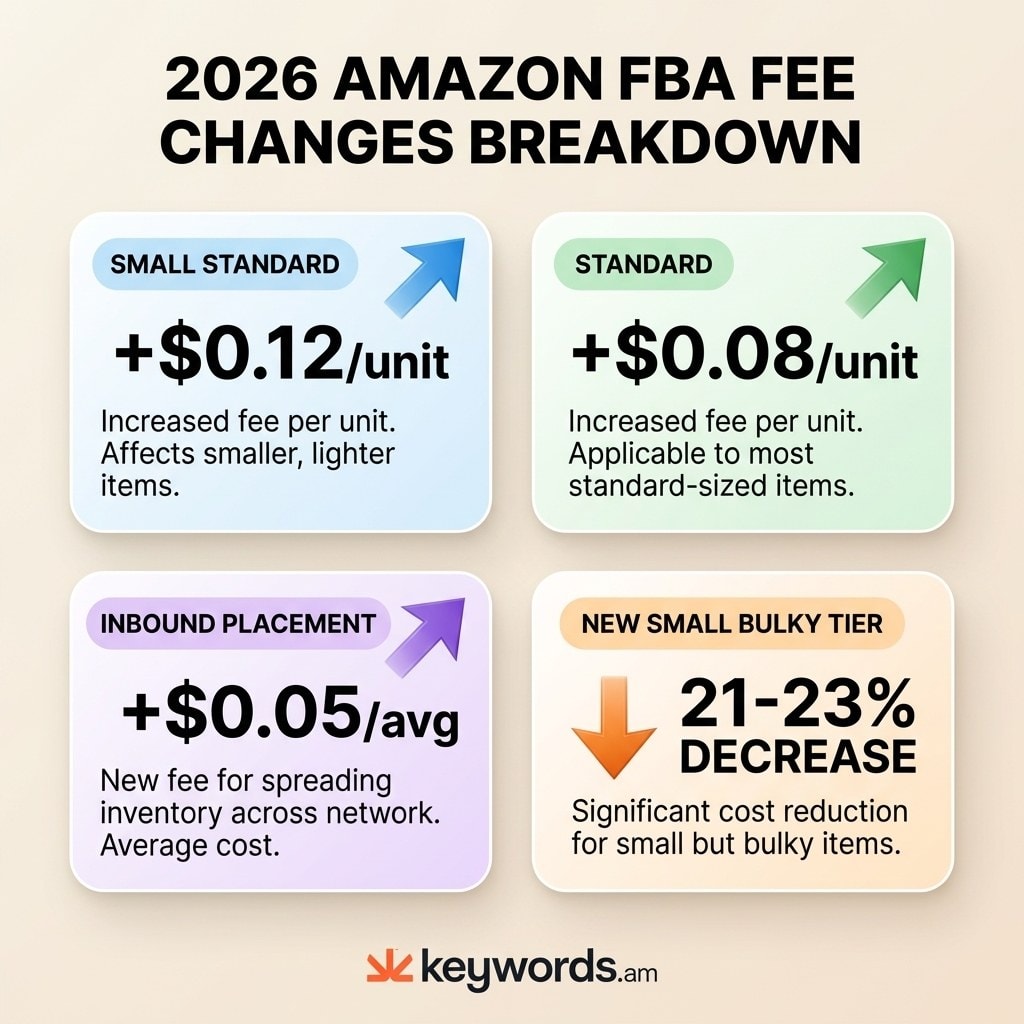
Since 2024, Amazon has charged inbound placement fees for shipments not split across multiple fulfillment centers. As of early 2026, these fees ticked up by about $0.05 on average per unit. Sellers who skip this line often find their real margin runs $0.25 to $0.70 lower per unit than the calculator suggested.
4. Using the wrong size tier
Fulfillment fees jump in tiers based on packaged dimensions and weight. Being 0.1 inches over a threshold can push a product from Standard into Large Standard and add $2 to $5 per unit.
Always measure with final packaging. Amazon measures the box or poly bag, not the bare item. Amazon publishes the current FBA fee schedule on its Selling Partners site.
5. Skipping aged inventory surcharges
Inventory sitting 271 to 365-plus days gets hit with surcharges that can reach several dollars per cubic foot per month as of 2025. A product that looked profitable on day one can turn into a money pit by month ten. Demand forecasting matters as much as fee calculation.
Avoiding these mistakes needs both accurate fee data and honest demand data.
Why does keyword optimization affect FBA profitability more than fee estimation?
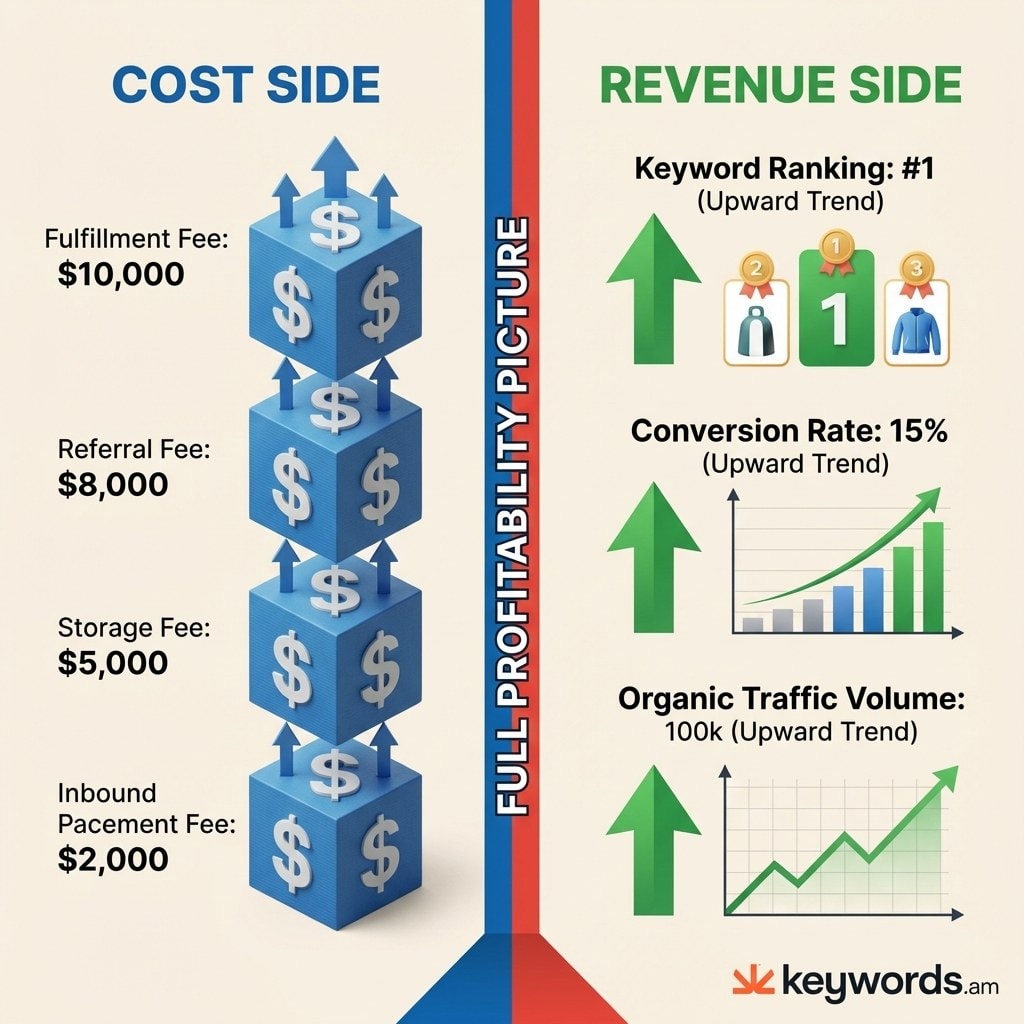
Keyword optimization drives conversion rate and organic ranking, which compound profitability far faster than shaving cents off fulfillment. Every Amazon FBA calculator focuses on the cost side. Profitability has two sides.
Two sellers with identical products, landed costs, and FBA fees can end up with very different profits. The gap is organic visibility.
Run the math. Saving $0.08 per unit on 1,000 monthly units is $80/month. Meaningful, but modest. Now picture a seller who lifts conversion rate from 10% to 15% on a $25 product through better keyword targeting. That’s roughly 50 additional sales per month, or about $1,250 in extra revenue.
The chain compounds: better keywords lead to higher search visibility, more organic clicks, higher Amazon conversion rate, less PPC dependency, lower TACoS, and higher net margin. A seller paying $3 per click for a term they could rank for organically is leaving real money on the table week after week.
Before committing inventory, the keyword landscape tells you whether organic visibility is even possible for a product or whether you’ll pay for every click. Start with structured Amazon keyword research methodology, then apply the findings to your product title and bullet points.
Already running ads? Amazon PPC optimization cuts wasted spend while keyword work builds the organic rank that eventually replaces those paid clicks. Calculators handle the cost floor. Keyword research raises the revenue ceiling. You need both.
The TFSD framework covers research, listing drafting, and publishing to Seller Central in one workflow, which is where the revenue gains no FBA calculator can estimate actually show up.
Frequently Asked Questions About Amazon FBA Calculators
What’s a good profit margin for Amazon FBA in 2026?
Most sustainable FBA sellers target a 15% to 25% net margin after every fee, ad spend, and return is accounted for. Anything below 10% leaves almost no cushion for fee hikes or storage spikes. High-velocity products can survive on thinner margins because inventory turns before aged surcharges hit.
How accurate is Amazon’s free Revenue Calculator?
It’s reliable for referral fees and standard fulfillment costs, which are the two biggest line items. It typically skips inbound placement fees, aged inventory surcharges, and returns processing, so the real cost per unit runs $0.50 to $1.50 higher than the estimate. Treat the output as a floor, not a final number.
Is Amazon FBA still profitable in 2026?
Yes, FBA remains profitable for sellers who model every fee category, not just the obvious ones. Amazon left referral rates untouched for 2026 but raised inbound placement fees by roughly $0.05 on average as of early 2026. Sellers using calculators that cover all fee layers tend to keep margins healthier than those relying on Amazon’s tool alone.
What fees do most Amazon FBA calculators miss?
The common blind spots are inbound placement fees, aged inventory surcharges past 271 days, returns processing, and low-inventory-level fees. Free calculators rarely include a returns rate input, which alone can overstate margin by 3 to 5 percentage points on categories like apparel or electronics.
Does a better calculator matter more than better keywords?
No. Saving a few cents per unit on fees is worth real money, but improving conversion rate through targeted keywords compounds far faster. A five-point conversion lift on a $25 product can add $1,000+ per month in revenue, which dwarfs any fee optimization.
Conclusion
- Amazon’s free Revenue Calculator sets the cost floor but misses inbound placement, returns, and aged inventory fees.
- Paid tools like Helium 10 and SellerApp fill the gap with ASIN lookup, multi-marketplace coverage, and FBA vs FBM comparisons.
- Hidden fees can drop a 43% theoretical margin below 30% once Q4 storage and returns processing land.
- The biggest profit gains come from the revenue side, not the cost side: better keywords lift conversion and cut PPC dependency.
- Model fees monthly, not once, because Amazon adjusts pricing throughout the year.
Start with one product. Run it through Amazon’s Revenue Calculator to set the cost floor, then check whether the listing targets the right keywords for the traffic you actually need. For the keyword side of the equation, Keywords.am’s free Amazon keyword tool handles research, listing drafting, and publishing to Seller Central in one workflow.