Amazon Fundamentals
Amazon Sales Dropping? Find the Real Cause (3-Layer Diagnostic)
Amazon sales dropping? Use this 3-layer diagnostic to separate traffic from conversion problems, find the root cause, and apply the matching recovery path.
Amazon sales dropping triggers a specific kind of panic. Sellers open twelve tabs, check every metric at once, and still can’t pinpoint what changed. Most “why are my Amazon sales down” guides dump five to nine possible causes without a structured way to narrow the list.
Sellers end up guessing, wasting days fixing things that aren’t broken while the real cause goes unaddressed. The fix is a diagnostic order of operations, not a longer checklist.
This article introduces a three-layer diagnostic: traffic, conversion, and market. Each layer maps to specific metrics in Seller Central Business Reports and Brand Analytics, with a clear fork that tells you where to go next.
What should you check first when Amazon sales drop?
The first step is identifying when sales changed, not why. Correlate the drop date with listing edits, inventory events, algorithm shifts, and competitor moves to narrow the cause.
Random troubleshooting fails because it ignores the sequence of events. You have to isolate the exact day the downward trend began before touching any listing variables. A clear timeline eliminates dozens of potential culprits in one step.
Compare the drop date against four event types:
- Listing changes. Title updates, backend search term edits, or main image swaps causing ranking shifts.
- Inventory events. Stockouts or FBA receiving delays that interrupt search visibility.
- Algorithm updates. Amazon search changes or category policy shifts during that window.
- Competitor moves. A rival launching a new variant, dropping price, or spiking ad spend.
Go to Business Reports > Detail Page Sales and Traffic by Date in Seller Central. Look at a rolling 30 or 60 day window. A sudden cliff usually indicates a technical failure like suppression or Buy Box loss, while a slow bleed suggests competitor pressure or keyword ranking decay.
Here’s a common trap: sellers check overall account sales and assume everything’s tanking. Usually the drop is isolated to one or two ASINs carrying the bulk of revenue. Filter per-ASIN first to save hours of chasing ghosts across the entire product line.
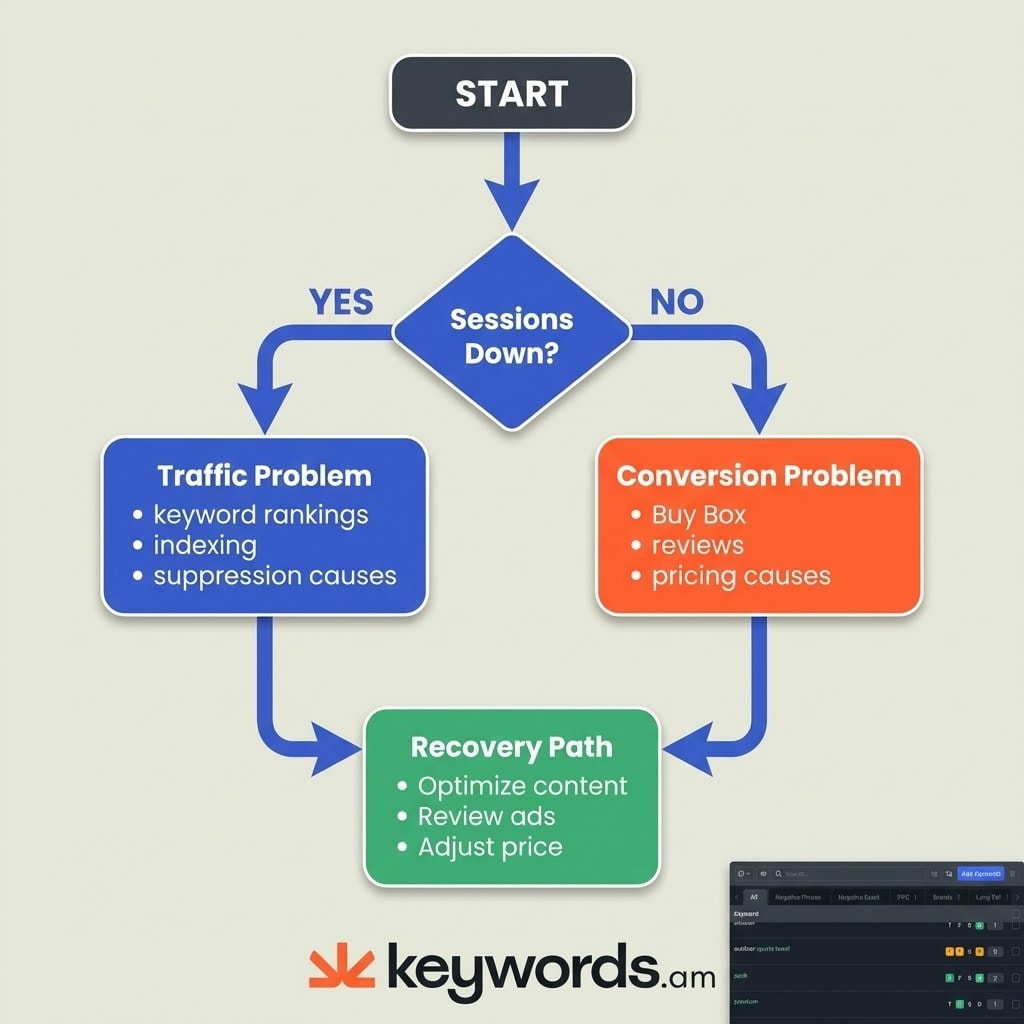
Is it a traffic problem or a conversion problem?
Check sessions and Unit Session Percentage in Business Reports. If sessions dropped, it’s a traffic problem. If sessions held but conversion fell, it’s a listing or offer problem.
This is the fundamental diagnostic fork. Every case of Amazon sales dropping stems from either fewer people seeing the product or fewer people buying after they click. Separating these two stops you from optimizing a listing that needs more visibility, or doubling ad spend on a page that needs better content.
Traffic problem indicators look like sessions trending down, page views dropping week over week, and impressions declining in the Search Terms report. The algorithm isn’t displaying the offer to potential buyers.
Conversion problem indicators look different: sessions stay stable, but Unit Session Percentage (orders divided by sessions) declines. Shoppers find the product but choose a competitor instead.
Find both metrics under Business Reports > Detail Page Sales and Traffic by Child Item. Brand Registered sellers should cross-reference with the Search Query Performance dashboard in Brand Analytics.
| Symptom | Sessions | Conversion (USP) | Diagnosis | Next Step |
|---|---|---|---|---|
| Visibility loss | Down | Stable or slight dip | Traffic problem | Check keyword rankings, indexing, ad impressions |
| Listing/offer issue | Stable | Down | Conversion problem | Check Buy Box, reviews, price, listing content |
| Compound decline | Down | Down | Start with traffic | Fix visibility first, then reassess conversion |
What causes Amazon traffic and visibility to decline?
The six most common traffic killers are keyword ranking loss, keyword deindexation, listing suppression, Browse Node errors, reduced ad impressions, and declining SQP impression share.
Keyword ranking loss is the most frequent culprit and the sneakiest. A gradual drop on core keywords where a product held page one won’t show up as an alert anywhere in Seller Central. There’s no “ranking dropped” notification, so sellers just see fewer sales and can’t figure out why. When a product slips from position 4 to position 14, traffic dries up fast.
Keyword deindexation is more severe and more binary. Amazon simply stops indexing the listing for specific search terms, making it invisible even on page 10. Quick test: search the ASIN alongside the suspected keyword, and if nothing appears, that term is deindexed.
Listing suppression hides listings from search for policy violations and can be full or partial (accessible via direct link but invisible in search). Common triggers include missing main images, restricted keywords in title, or pricing errors.
Browse Node miscategorization reduces relevance signals. Wrong category assignment means the algorithm assumes the product can’t satisfy search intent, dropping organic impressions.
Reduced ad impressions hurt sellers relying on PPC for traffic. Check Campaign Manager impression trends, and audit Amazon negative keywords to eliminate wasted spend.
Declining SQP impression share reveals competitive blind spots. Brand Analytics shows the exact share of impressions on specific queries, and a downward trend means competitors are pushing the product lower. Effective Amazon keyword research methodology prevents most of these issues at the source.
What causes Amazon conversion rates to drop?
Conversion drops typically stem from Buy Box loss, a negative review spike, price competitiveness erosion, listing content degradation, or competitor A+ Content improvements.
Buy Box loss is the single fastest way to kill conversion. If another seller wins the featured offer, or Amazon suppresses the Buy Box entirely because of off-platform pricing, conversion collapses overnight. Shoppers almost never click secondary offer links.
A negative review spike hits harder than most sellers expect. Anecdotally reported by sellers, a cluster of two or three new one-star reviews can noticeably reduce conversion on listings with fewer than 100 total reviews, especially when the star rating crosses a visible threshold (4.5 to 4.2). That fractional drop changes how shoppers read the listing in a split second.
Price competitiveness erosion happens silently. Competitors drop prices, or the listing loses Amazon’s “Was/Now” discount badge, and a similar product in the “Related Items” carousel at a 20% discount pulls shoppers away. Pair pricing analysis with Amazon conversion rate benchmarking before assuming the listing copy is the problem.
Listing content degradation occurs when Amazon overwrites titles, merges duplicate listings, or suppresses images. Retail contributions sometimes override Brand Registry updates, so compare the live listing against the last known-good version.
Competitor A+ Content improvements make existing listings look outdated by comparison. A rival upgrading brand story modules, comparison charts, and video content turns basic text into a liability. Routine Amazon competitor analysis prevents falling behind, and refreshed Amazon A+ Content keeps your detail page competitive.
How do you diagnose keyword ranking loss on Amazon?
Run a reverse ASIN lookup on top competitors, compare their keyword rankings against yours, and track changes over time to identify which keywords are slipping.
When Amazon sales dropping is the symptom, sales data alone never reveals which search terms a product abandoned on page one. Competitive intelligence fills that gap, and reverse ASIN lookup explained walks through the full workflow.
Step 1: Identify top revenue-driving keywords
Pull this list from the PPC Search Term Report or Brand Analytics Search Catalog Performance. Build a baseline of 10 to 15 core terms that historically generated the bulk of organic sales. Let historical data dictate which keywords matter rather than guessing.
Step 2: Check current organic ranking
Confirm whether those core terms are still on page one. Manual searching is unreliable due to Amazon’s personalization and location algorithms, so use a keyword tracker that returns objective rank data.
Step 3: Run reverse ASIN on competitors
This is where the blind spots get exposed. A competitor launching a new variant, running aggressive exact-match PPC, or driving external traffic can quietly steal organic positions that took months to earn.
Step 4: Map ranking changes to the sales timeline
If keyword ranking drops started 7 to 14 days before sales fell off, that’s your answer. There’s always a lag between losing rank and losing revenue, because the algorithm momentum runs out gradually before sales follow.
Brand Analytics Search Query Performance shows impression share, click share, and purchase share. Declining purchase share on a stable-volume query means competitors are winning the same shoppers, and Keywords.am tracks daily ranking changes to flag drops automatically.
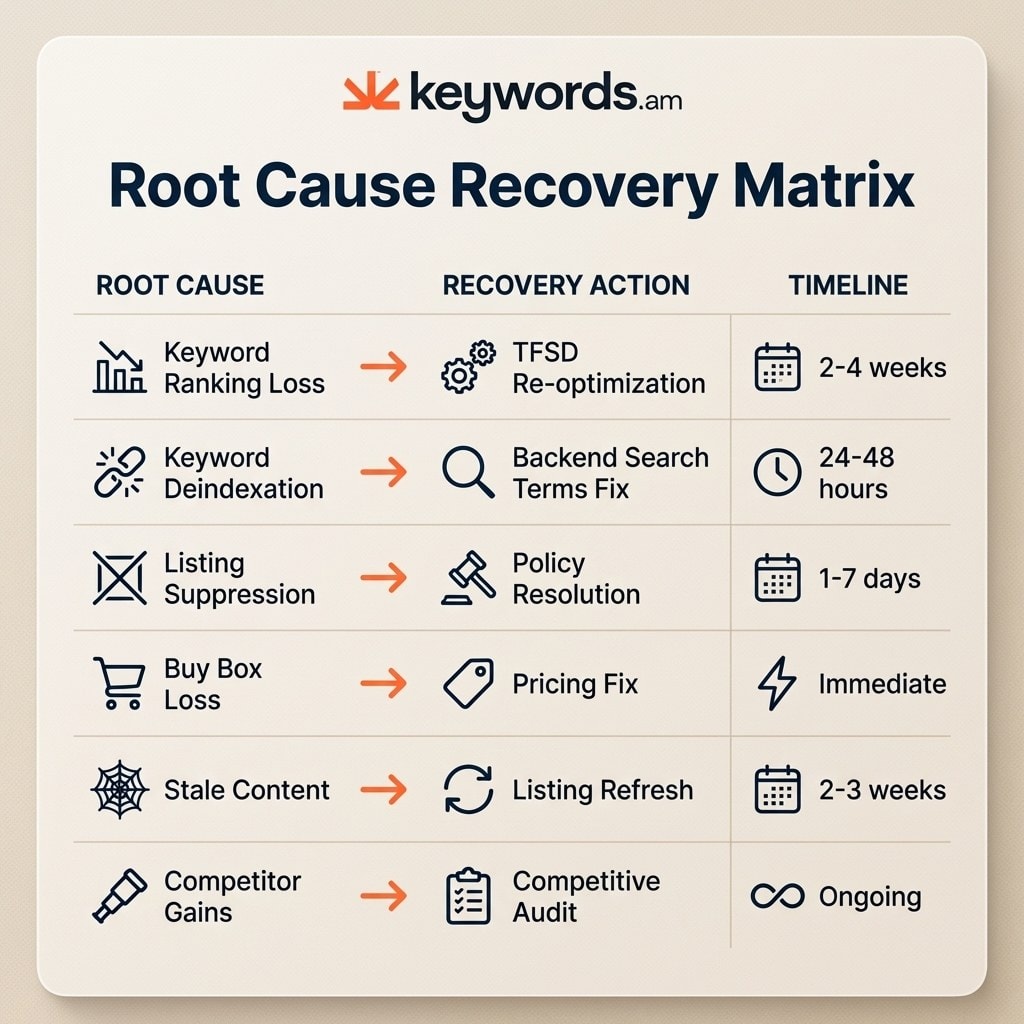
How do you build a recovery plan after diagnosing the cause?
Match each root cause to its recovery path: the TFSD Framework for keyword issues, Buy Box fixes for offer problems, or strategy shifts for market changes.
Understanding why Amazon sales dropping happened is only half the battle. Applying a conversion fix to a traffic problem wastes time, changing the main image won’t fix a deindexed search term, and lowering price won’t restore a suspended listing. Every action must target the specific root cause.
| Root Cause | Recovery Action | Deep Dive | Timeline |
|---|---|---|---|
| Keyword ranking loss | Re-optimize Title, Features, Search Terms, Description | TFSD Framework Guide | 2 to 4 weeks |
| Keyword deindexation | Verify indexation, refresh backend search terms | Amazon Backend Keywords | 24 to 48 hours |
| Listing suppression | Resolve policy violations, resubmit listing | Amazon Listing Optimization | 1 to 7 days |
| Buy Box loss | Fix pricing, FBA eligibility, seller metrics | What Is Amazon FBA | Immediate to 2 weeks |
| Stale listing content | Refresh title, bullets, images, A+ Content | Bullet Points Guide | 2 to 3 weeks |
| Competitor gains | Audit competitor keywords and listings | Competitor Analysis | Ongoing |
When the decline isn’t your fault
External factors disrupt sales across entire categories. Algorithm updates shuffle search results for weeks, and category-wide demand shifts happen during seasonal transitions or tariff changes.
Check category Best Seller Rank trends. If all top competitors show similar declines at the same time, the issue is market-wide, not listing-specific. Adjust inventory and ad budgets rather than over-optimizing a listing already performing at market capacity.
How do tariff changes and external market shifts trigger Amazon sales drops?
Not every sales drop is a listing problem. Some of the most severe revenue declines from 2024 through early 2026 originated entirely outside the listing, from macro trade policy, category-wide demand shifts, and platform policy changes that hit entire seller populations at once.
Sellers who misdiagnose external drops as internal listing failures waste weeks optimizing the wrong variables. The traffic vs. conversion fork still applies, but the recovery path differs entirely when the market itself is the problem.
Tariff-driven cost increases
Section 301 tariffs on Chinese imports, expanded again in 2024 and 2025, increased landed costs across many Amazon categories. Electronics components, home goods, and apparel sourcing from China saw meaningful cost increases (commonly reported in the 20% to 60% range, as of 2025). Sellers absorbing higher COGS without adjusting prices faced margin compression that eventually forced repricing.
The sales drop pattern from tariff-driven repricing, commonly observed across categories that depend on China sourcing, tends to follow a predictable sequence:
- Price rises (typically 10% to 15%) to preserve margin.
- Unit Session Percentage drops within a couple of weeks as competitors hold lower prices.
- Amazon’s algorithm deprioritizes the listing in search results because conversion signals weaken.
- Sales velocity drops, which further degrades organic rank.
- BSR falls, reducing Browse visibility on top of keyword visibility.
The fix requires a supply chain response, not a listing response. Sellers who attempt to recover through listing optimization alone while maintaining uncompetitive pricing typically see continued decline.
Algorithm shifts and category policy changes
Amazon updates its search algorithm continuously, and major shifts can affect thousands of listings without any per-seller notification. Identifying an algorithm shift as the cause requires checking competitor performance side by side.
If the top five ASINs in a category all show similar rank declines during the same two-week window, the cause is almost certainly external. Category-level BSR charts in Brand Analytics confirm this pattern quickly.
Seasonal demand valleys
Categories with pronounced seasonality (outdoor furniture, gardening tools, holiday décor, pool accessories) face predictable demand valleys that newer sellers often misinterpret as listing failures. Q1 is typically the weakest quarter for non-gift categories.
Sales dropping 30% to 40% from a December peak into January is normal for these product types, not a sign of listing degradation. Calibrating expectations against the prior year’s seasonal pattern prevents overreaction, and disciplined ad spend protects rank through the valley.
When to treat a drop as external vs. internal
| Signal | External (market) problem | Internal (listing) problem |
|---|---|---|
| Competitor rank movement | All top 5 also declining | Competitors holding or gaining |
| Category BSR trend | Category-wide decline | Category stable, ASIN declining |
| Keyword search volume | Declining across category terms | Stable or growing volume, share lost |
| Recovery lever | Pricing, sourcing, wait for season | TFSD listing optimization, PPC |
External drops require patience and supply chain or pricing responses. Internal drops require the keyword and listing diagnostics covered throughout this guide. Confusing the two is one of the most expensive mistakes an Amazon seller can make.
What are the early warning signs that Amazon sales will drop?
The early warning signs are declining SQP impression share on core keywords, rising PPC ACOS without rank gains, Unit Session Percentage trending down for several weeks in a row, and competitor review velocity accelerating on adjacent ASINs.
Revenue decline is a lagging indicator. By the time sales show a meaningful drop, the underlying causes have typically been building for two to six weeks. Monitoring leading indicators catches problems at the source before they cascade.
Impression share decay before revenue drops
Brand Analytics Search Query Performance provides weekly impression share data on specific queries. In our observation, when a product’s impression share on a top-10 keyword drops meaningfully (often 20% or more) across two consecutive measurement periods, revenue tends to follow within a few weeks. The ranking slips first, buyer exposure drops next, and sales follow last, which is exactly the window proactive sellers use to intervene.
ACOS rising without rank benefit
If PPC campaigns need higher bids to hold the same ad position while organic rank simultaneously slides, a competitor has strengthened their relevance for those keywords. Listings with broad keyword coverage across title, bullets, backend, and A+ Content resist this competitive erosion longer than listings relying on a handful of head terms. Audit your Amazon product title optimization and pair it with steady Amazon PPC optimization to defend rank.
Unit Session Percentage weekly trend
Conversion rate can erode for weeks before it shows up in aggregate revenue. Monitor Unit Session Percentage at the child ASIN level weekly, not monthly. A listing converting at 15% USP that loses a point and a half per week reaches around 10.5% in a month, which is roughly a 30% conversion loss before most sellers check the data.
Competitor review velocity
Track competitor review counts monthly on the top three to five competing ASINs. When a competitor closes a review gap rapidly, especially while accumulating positive reviews, conversion pressure builds on your existing listing. Fractional star drops reliably reduce click-through rate in search weeks before they appear in USP data.
| Early Warning Signal | Where to Monitor | Intervention Threshold |
|---|---|---|
| SQP impression share decline | Brand Analytics SQP | Drop across 2+ consecutive weeks |
| ACOS rising without rank improvement | Campaign Manager + rank check | Sustained ACOS rise over 30 days |
| Unit Session % weekly decline | Business Reports by child ASIN | Sustained drop over 3+ weeks |
| Competitor review velocity surge | ASIN monitoring | Competitor gaining reviews rapidly |
| Star rating fractional drop | Live listing monitoring | 0.2+ star drop in any 30-day window |
Sellers who watch these five signals monthly can address keyword drift and competitive pressure while it’s still manageable, well before the full three-layer diagnostic becomes necessary.
Frequently Asked Questions About Amazon Sales Dropping
Why did my Amazon sales suddenly drop to zero?
A sudden drop to zero usually means listing suppression, Buy Box loss to a hijacker, or an inventory issue like stranded inventory. Check Seller Central alerts first, then verify the listing is active, the Buy Box is owned, and FBA inventory shows “Available.” If status reads “Currently unavailable,” it’s likely suppression or an inventory block.
Does a stockout hurt Amazon keyword rankings?
Yes. Running out of stock causes Amazon to deprioritize or deindex the listing from search results, and rebuilding rankings after restocking typically takes two to four weeks depending on keyword competitiveness. A three-day stockout often recovers within days, while a three-week stockout can reset rankings and require aggressive PPC to recover.
How long does it take to recover Amazon sales after a stockout?
Recovery generally takes one to four weeks depending on stockout duration. Short stockouts under five days tend to bounce back faster, while extended stockouts of two weeks or more may require full re-launch efforts with heavy PPC support and price testing.
Can negative reviews cause Amazon sales to drop?
Yes. Sellers commonly report that a cluster of two or three new one-star reviews can meaningfully reduce conversion on listings with fewer than 100 total reviews, particularly when the average star rating cr